The Leventhal Center holds an extraordinary collection of urban atlases dating between the late 19th and early 20th centuries. Our digital tool Atlascope makes it easier for patrons to interact with the georeferenced versions of these maps, helping users find the homes of ancestors, research the history of their neighborhoods, or expand their knowledge of a Boston long since past.This summer, the Center’s Geohumanities & GIS interns helped expand Atlascope by digitizing new urban atlas layers, researching geospatial datasets that could be combined with it, and writing their own interpretive Atlascope tours. Below, Simone Tricca and Anna Zhang—two of the Geohumanities & GIS interns from this summer—reflect on their time at the LMEC and the impact of their work.
Studying geospatial data with Atlascope
By Simone Tricca
At the beginning of my internship this summer, I was very new to the world of mapping and really excited to be exposed to new ways of thinking about space, data, and history. I began by learning the basics of georeferencing, and throughout the summer I contributed to the LMEC’s ongoing Atlascope project.
When I wasn’t helping patrons find their Boston-area addresses on the Atlascope monitor in the gallery, I continued to expand the area covered by Atlascope outward to new locations. I georeferenced an 1880 Attleboro atlas, two Nahant atlases from 1880 and 1896, and made progress on a Beverly atlas from 1897. Georeferencing older atlases with all their mistakes, quirks, and surveying errors proved challenging, but bringing all the plates together in a unified map layer was a very satisfying and rewarding experience. In the gallery, I had so much fun speaking to patrons about the process of georeferencing and showing them the work that goes into the finished Atlascope site that they could explore.
I also worked on an independent project about geospatial data, with the goal of locating geospatial datasets that the Leventhal Center might be interested in preserving and sharing. I chose this type of project because I was excited to learn more about working with geospatial data and exploring the datasets available in Massachusetts.
I focused on finding datasets oriented around civic life and history in Boston, particularly those that could be combined with Atlascope in illuminating ways. Even with these parameters in place, the final list of datasets that I compiled spanned several themes, including agriculture, recreation, Indigenous history, and Boston and Massachusetts history. One highlight was a map of farmer’s markets around Massachusetts, created by the Massachusetts Department of Agricultural Resources, which includes details about the markets’ open hours and food assistance programs. The map is updated regularly, and could be worth saving periodically to track changes in farmer’s market availability in the state.
A snapshot of the Massachusetts Department of Agricultural Resources’ MassGrow Map
Another highlight is the list of Nipmuc place names, compiled and published by the Nipmuc Indian Association of Connecticut (NIAC). This dataset is the intellectual property of NIAC and the names themselves are the intellectual and cultural property of the Nipmuc community. The list includes the names of locations in many of the New England states in the Nipmuc language, as well as their English translations and other details about the history and landscape of the places listed. If transformed from a plain text document to a format with added geospatial data, this geographic information could provide a geographic aid for finding familiar locations on a map and learning their Indigenous names, connecting them to the history and landscape of their area (similar to the Native Land project).
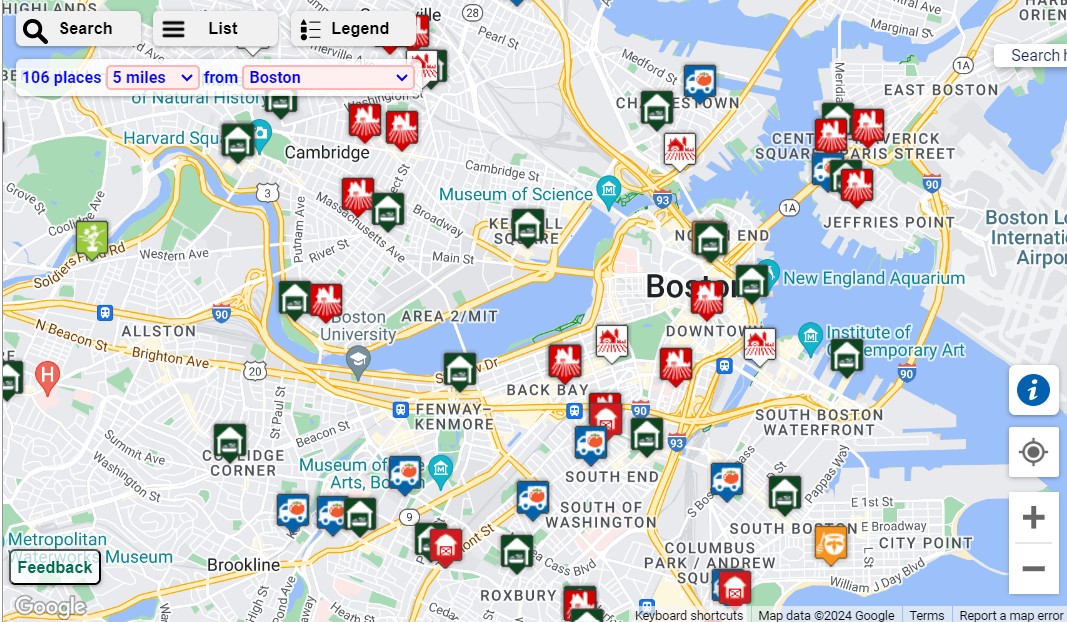
I spent the most time with the Massachusetts Historic Commission (MHC) Historic Inventory, an immense database of “locations of historical interest” in Massachusetts. When paired with Atlascope, this database provides even more information about many of the buildings visible in each atlas layer. The size and detail of the database also allowed me to filter the points to create more focused maps. Using a digital mapping tool called Felt, I overlaid an Atlascope layer from 1902 with locations from the MHC database that have since been demolished. Together with Atlascope, this dataset has so much potential to help visualize the development of the city of Boston, and eventually other cities and towns as well.
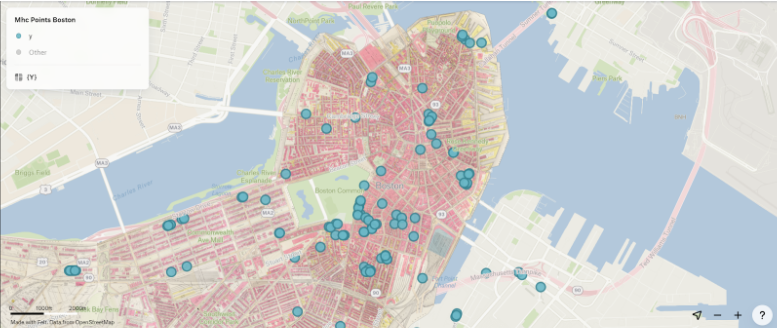
An Atlascope layer from 1902 with locations from the MHC database that have since been demolished, displayed in a Felt map
Once I got comfortable using Felt to display the datasets I was working with and combine them with Atlascope, I created a tutorial with pictures to explain the process. I was glad to be able to preserve and share what I learned this summer, and my hope is that future interns (and others!) will use this tutorial to inform their own mapping projects.
Atlascope outreach and research
By Anna Zhang
When I started my internship at the Leventhal Center in May 2024, I was immediately captivated by the vibrant historical Chinese maps on display for Heaven & Earth. In addition to welcoming guests to this exhibition, my internship consisted of two main projects: first, georeferencing maps of Massachusetts towns from the 1900s onto their present-day counterparts for eventual ingestion into Atlascope; and second, an independent project about geospatial librarianship that gave me valuable insights into other educational and cultural institutions in the Greater Boston area.
Using the online-based georeferencing software Allmaps, I worked with the rest of my cohort to georeference atlases in Taunton, Swampscott, and New Bedford (the latter of which is mostly built on a grid system!). While georeferencing these town atlases, I frequently noticed that shorelines and smaller bodies of water transformed over time. In coastal towns like Swampscott and New Bedford, the shorelines expanded significantly compared to the historical versions, whereas the Mill River in Taunton shrank in size after almost 150 years.
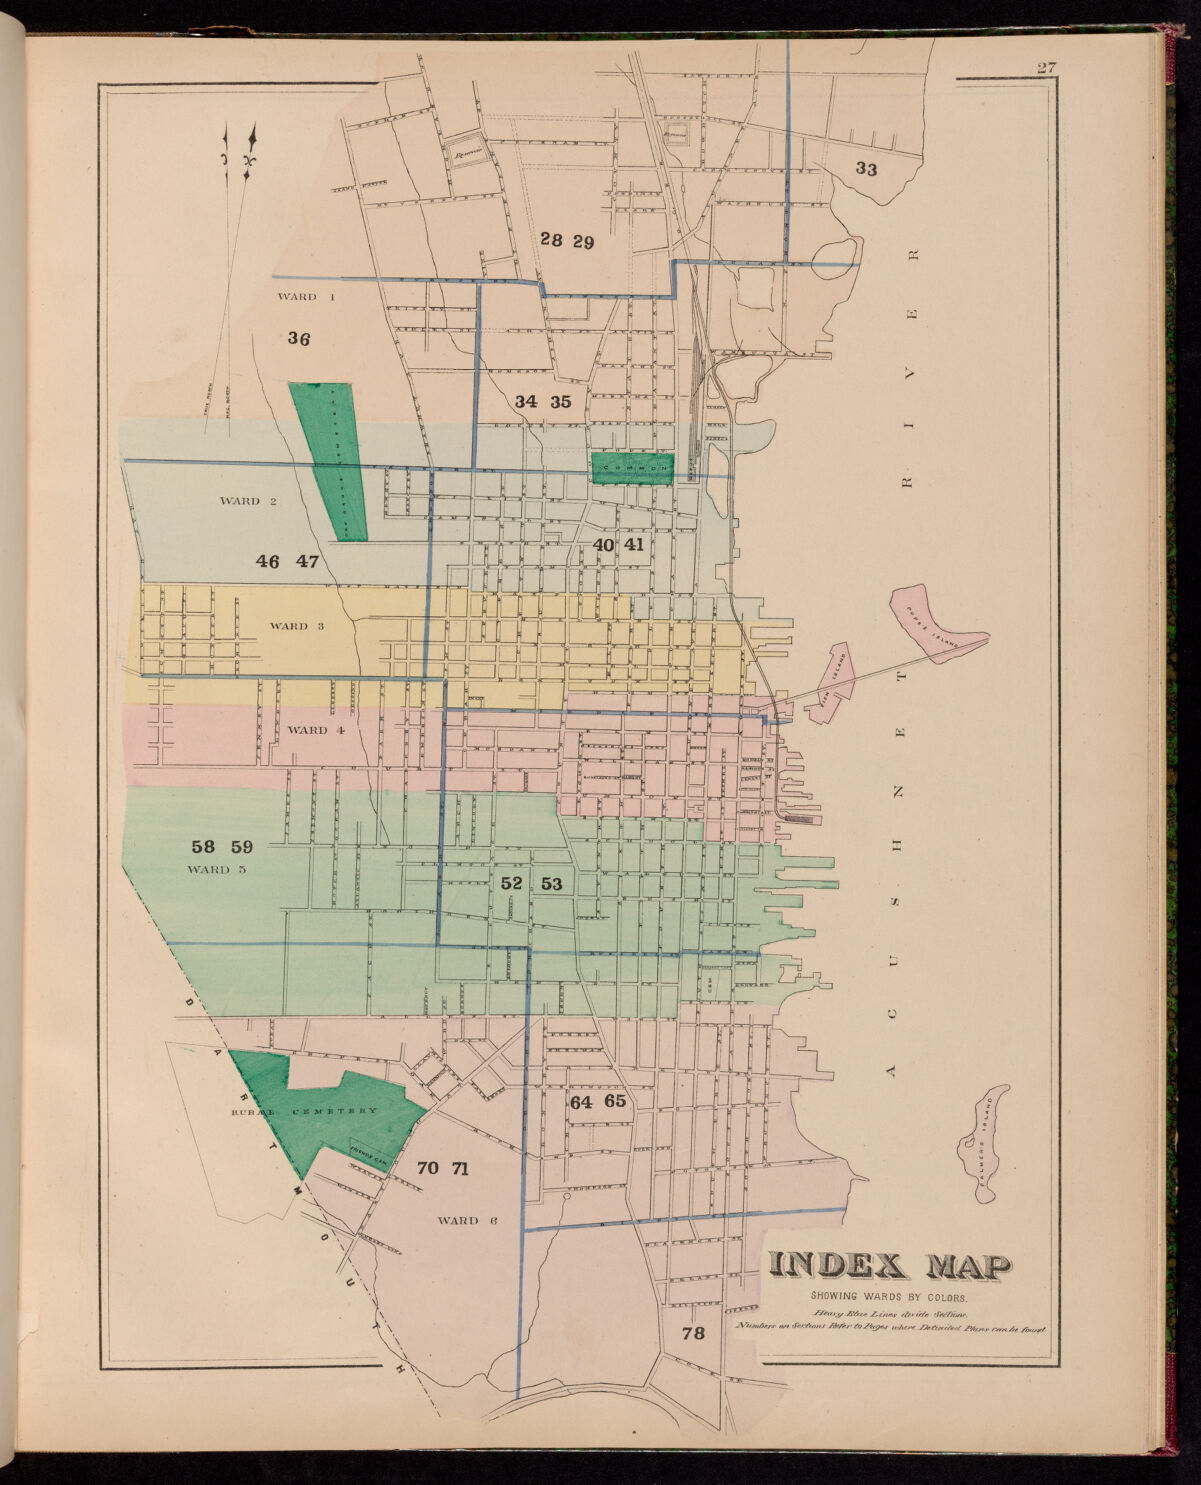
An index map from Geo. H. Walker & Co.’s 1881 Atlas of New Bedford city, Massachusetts
For my independent project, I researched different institutions that I thought could benefit from the using Atlascope in their work or outreach. Starting with the GIS and Urban Planning departments at my own college, I compiled information for universities and public libraries across the greater Boston area and the state of Massachusetts. I then worked with LMEC’s Development and Grants Manager to draft a communications sample for scholarly exchange and further connections.
In this process, I learned that higher education institutions in Boston—and libraries as far as Providence, RI!—are interested and actively participating in nuanced research that involves their local geography. It was, however, more of a challenge to specifically seek out nonprofit organizations and other unique cultural institutions that do not have the privilege of funding or the organizational support that large institutions have. Despite some of the comparative difficulties, I was still able to carve out applicable research possibilities aimed at targeting smaller organizations with less staffing to exchange new tools that might help with their works.
As the summer wound down, I used my remaining time to explore Atlascope’s research capabilities, looking for popular places that either remained extremely similar for the past century or areas that have been drastically changed by time. Places like the historic Boston & Rhode Island railway that sits on today’s Northeastern University campus, or the move of the Museum of Fine Arts from our very own Copley to its current location in the Fenway area, reveal how—and when—the Boston of the past was transformed in the recognizable Boston of the present.
Now, at the end of the summer, I can proudly say now that I know many more little details about a select few towns and cities around Boston, and that I’ve grown more comfortable working in a public setting dedicated to the advancement of knowledge on maps.
Our articles are always free
You’ll never hit a paywall or be asked to subscribe to read our free articles. No matter who you are, our articles are free to read—in class, at home, on the train, or wherever you like. In fact, you can even reuse them under a Creative Commons CC BY-ND 2.0 license.