Answering questions with many parameters
Geographic information systems (GIS), or the use of computers to create, store, and analyze spatial data, is .
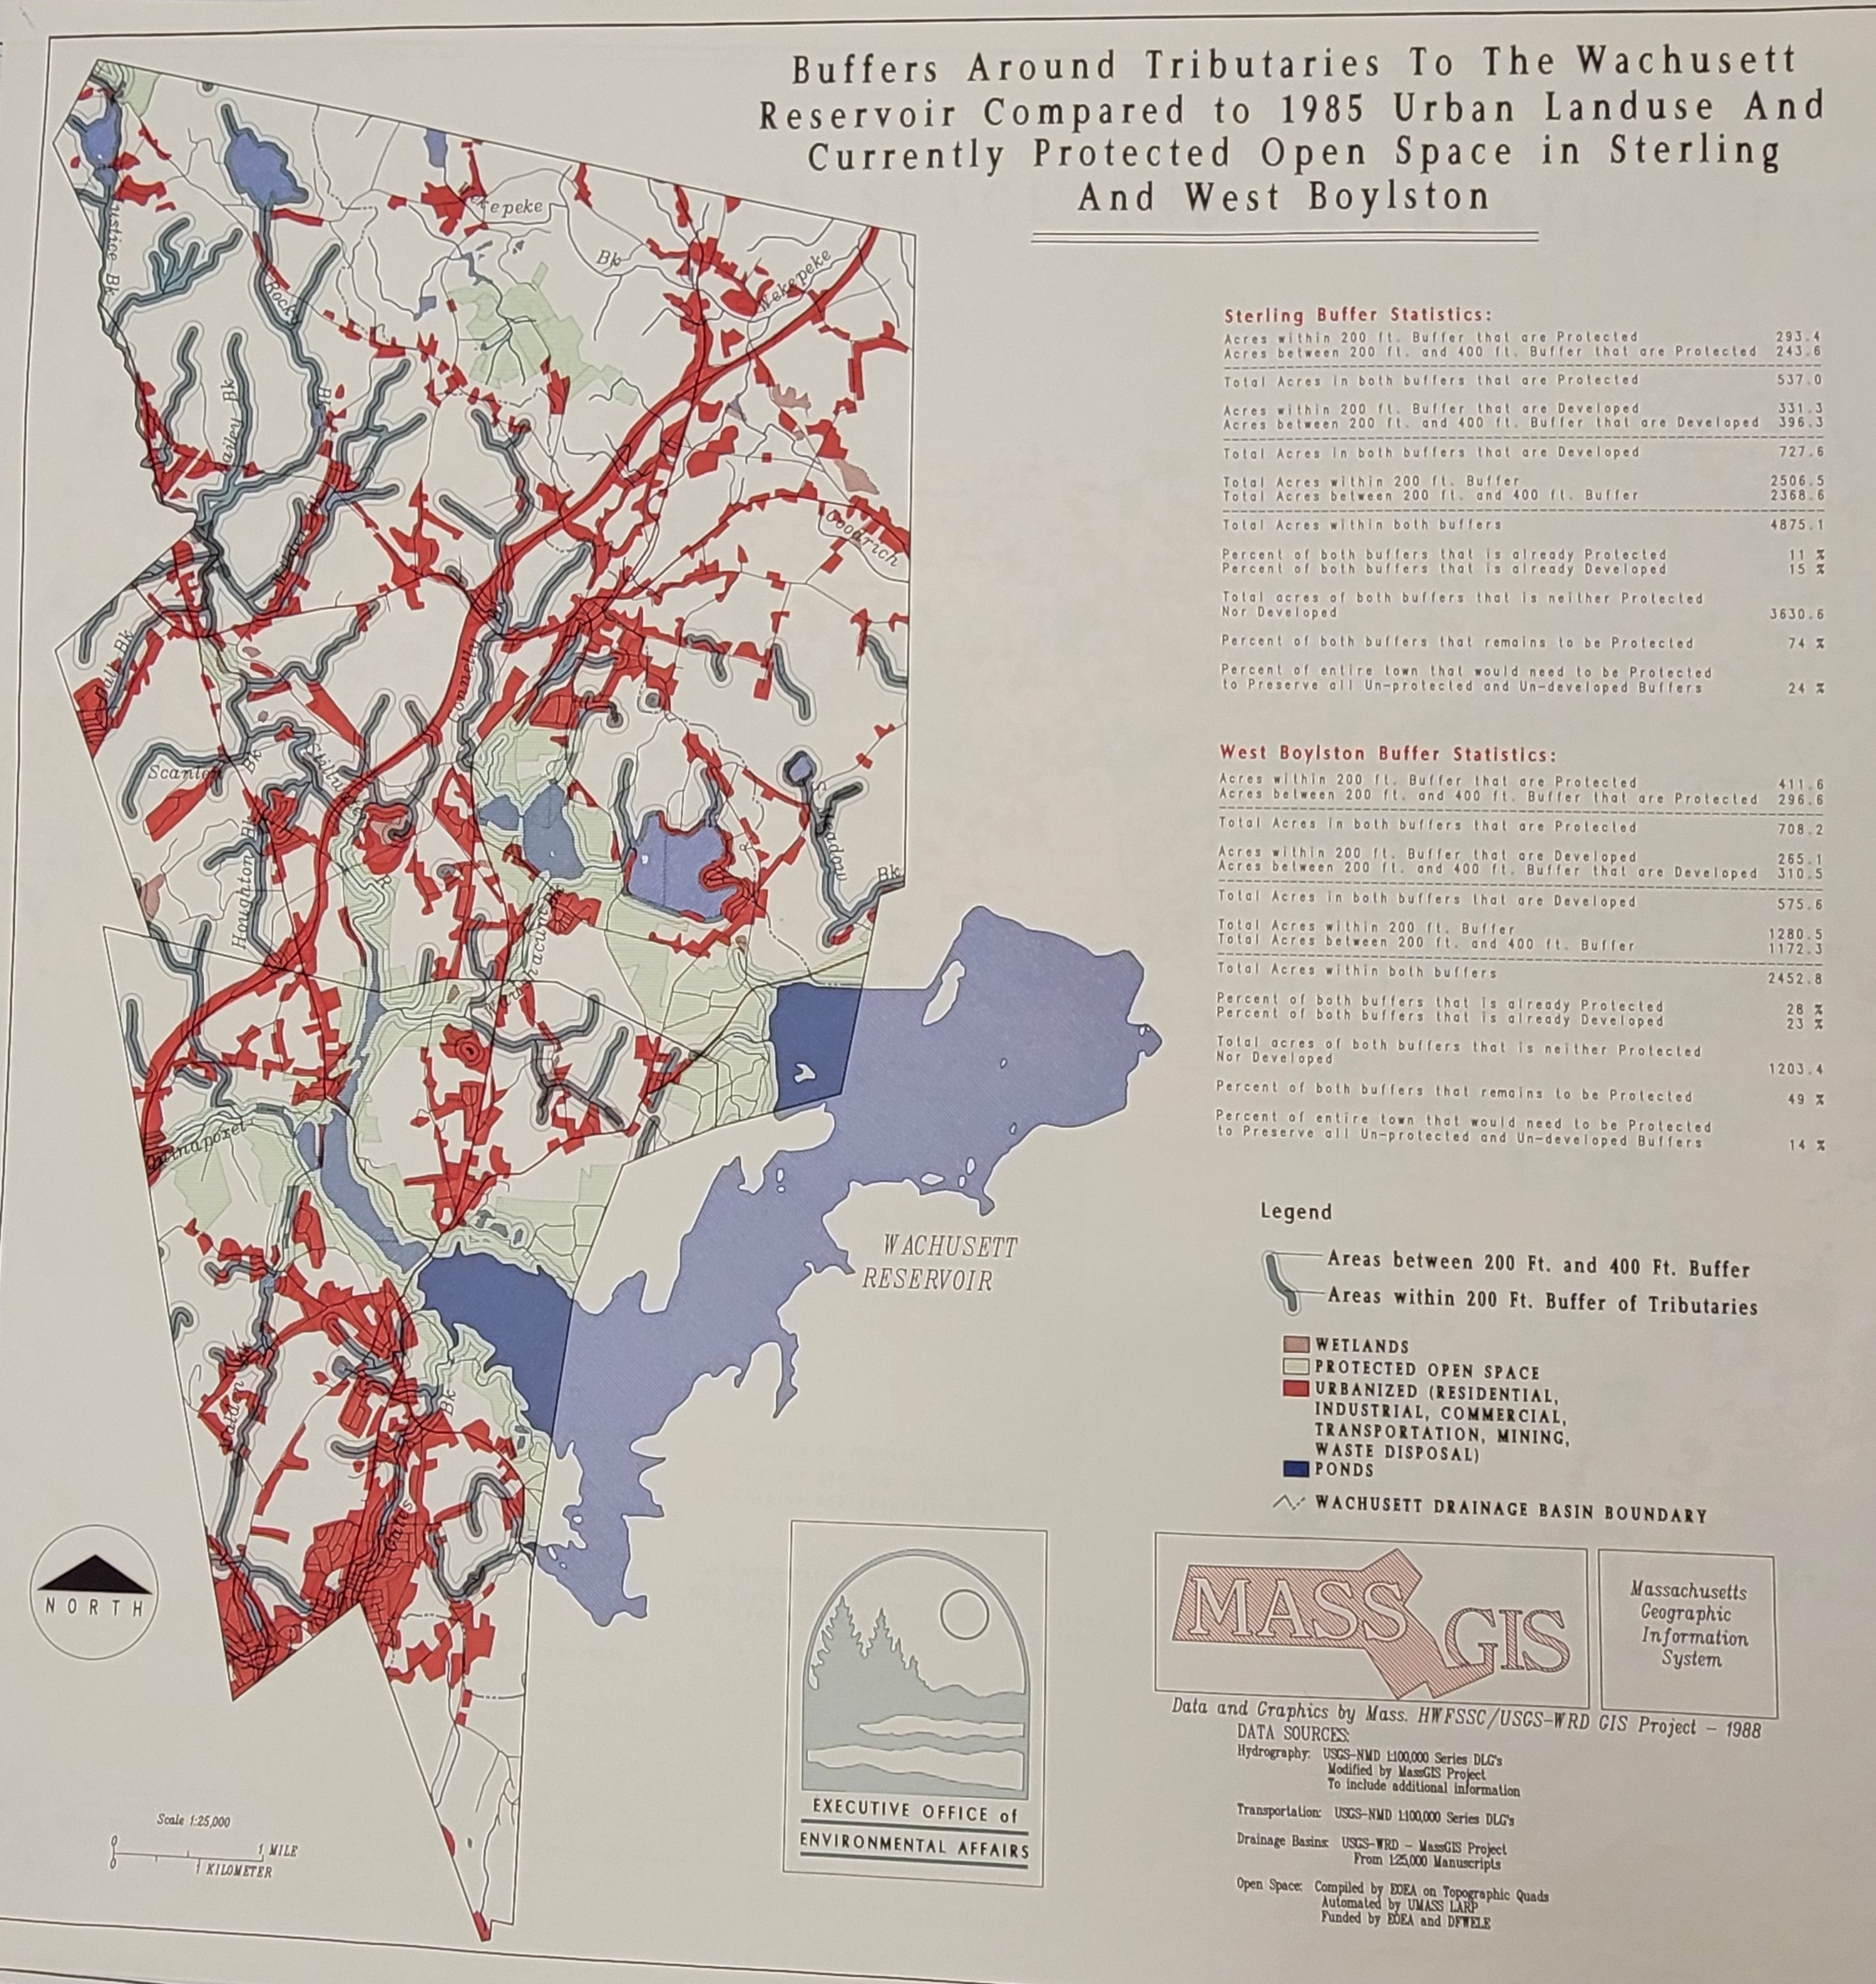
The map of the Wachusett Reservoir below, published by the Executive Office of Environmental Affairs in 1988, is a good example of the kind of spatial analysis that GIS made possible. Using a buffer tool, the map’s authors answered a question that had many spatial dimensions: 1) what percentage of unprotected area 2) within 200 feet of tributaries to the Wachusett Reservoir that 3) overlaps urban land use in Sterling and West Boylston?
Shadeset for electrostatic plotter, from the David J. Weaver Collection
Think about what information you need in order to answer this question.
This “layer-cake” method of visualizing and analyzing geospatial data, pioneered by Ian McHarg in 1962, made it possible for analysts to answer questions with multiple spatial conditions.
Map as evidence, calculation as output
We could argue that the most important aspects of this map aren’t necessarily on the map, but the data.
In this way, the , but if you just looked at the map by itself, you’d have a hard time figuring out what you’re supposed to get out of it. The calculations for Sterling and West Boylston are really what the audience needs to see. Two numbers—24% and 14%—
So much happened behind the scenes to generate two little numbers. And two little numbers
Why now? The paradox of new maps
Despite undergoing radical changes over the years, many conceptual aspects of mapmaking have remained the same. Cartographers still rely on “cake-layering” —a method [popularized by Ian McHarg](https://metropolismag.com/viewpoints/mcharg-design-with-nature-50th-anniversary/---to represent distinct geographic features. Furthermore, GIS doesn’t suitably capture the wide range of practices and theories associated with creating and storing spatial data over the long history of computer cartography. Many years
Our articles are always free
You’ll never hit a paywall or be asked to subscribe to read our free articles. No matter who you are, our articles are free to read—in class, at home, on the train, or wherever you like. In fact, you can even reuse them under a Creative Commons CC BY-ND 2.0 license.