In our current exhibition, More or Less in Common: Environment and Justice in the Human Landscape, we explore the impact of oil at various scales and geographies, and look at the role of maps in telling parts of this story. From the ground to the gas pump, oil production creates serious consequences for surrounding communities and environments: from increased CO2 emissions to oil spills, from air pollution to dangerous working conditions. The maps in our collections not only track the global oil economy, but also bear witness to this disparity between responsibility and burden.
Environmental costs and contradictions

This 1950’s poster of the Chevron Trail highlights the scenic landscape rather than oil extraction and gasoline fumes.
What’s the first thing you think of when you hear the word “environment”? If you live in the United States, the National Park system may come to mind. Following the conservation movement, many landscapes were ‘preserved’ into parks for future generations to enjoy and explore… that is, if they have access to a car. This 1950s pictorial map of the western United States shows the “Scenic West” dotted with idyllic scenes of each national park and encourages people to drive the “Chevron Trail” and let Standard Oil fuel the journey.
The colorful scenery serves to gloss over the impacts of the corporations behind the map. At its core, this map embodies a contradiction: it is an advertisement for companies trying to sell more oil, but the production of oil is a process that threatens natural environments and the communities that rely on them. Additionally, driving—which generally requires oil and creates a demand for further oil production—is the only way that many people will be able to even get to these national parks.
The global oil economy

Though they look beautiful, the colors on this map actually represent claims made by international companies scrambling to acquire the rights to oil-producing areas.
Many of the ecological harms of oil are first realized at the site of extraction, where crude oil spills pollute the natural environment often very far from the people who utilize the final product. This can be seen in this map of Venezuela and Colombia where the land was divided up by oil companies, many of which come from overseas.

This 1940 map from Fortune magazine portrays the world according to Standard Oil.
All over the world, oil is moved, from across America, Venezuela and the Middle East to Britain, Brazil and New York. This 1940 graphic from Standard Oil of New Jersey shows just a fraction of the oil that moved around the world at that time. Large enough to look like its own empire, Standard Oil sprawls over the world, extracting oil and moving it around, the yellow lines portraying oil traveling to its final destinations while the black represent its journey to be refined in places like Louisiana.
Sacrifice zones
The processing of crude oil brings its own ecological harms. Along the lower Mississippi, from Baton Rouge to New Orleans, lay many industrial facilities that leak waste and pollution into communities and the lived environment around them – including ones that process petroleum.

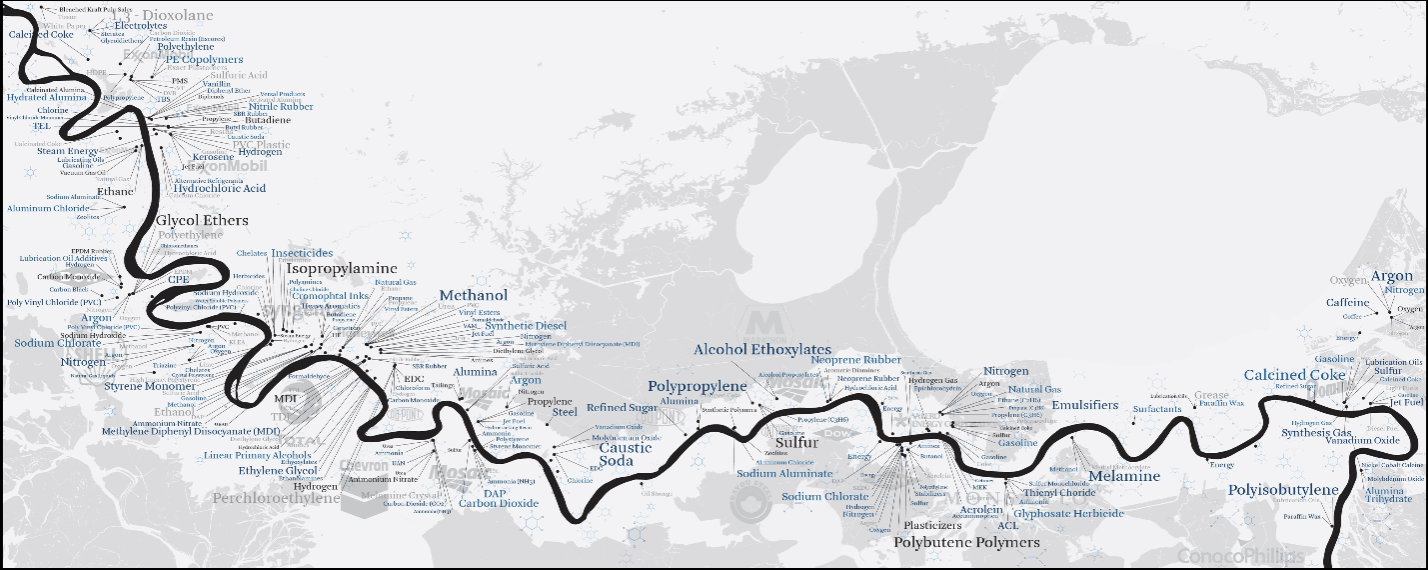
This map of the lower Mississippi River details the infamous “Cancer Alley,” where a concentration of petrochemical facilities has created a particularly hazardous combination of human and environmental forces.
This map from Petrochemical America highlights industries and products contributing to toxic air pollution, creating hazardous conditions for their employees and nearby communities. Little black dots represent the industrial facilities, surrounded with the names of chemicals they process or produce.
This map is a more somber depiction of the use of oil. While the other two were commissioned to portray the oil companies in a positive, colorful light, this one was created to show the negatives - using the stark black, white, grey, and blue to portray the myriad of chemicals people are exposed to. There are many industries—not just those that process oil—that cause the pollution in these communities, with their logos floating around the river.
Chevron’s logo pops up on this piece too, as a one of the ghostly specters behind the chemical pollution haunting the lower Mississippi. This area has often been called “Petrochemical America” or “Cancer Alley” because of the health impacts left behind by these prevalent facilities. It’s one example of a “sacrifice zone,” communities that have been repeatedly targeted by polluting industries and sites of environmental injustices.
Environmental injustices are also found closer to home, in communities in Chelsea and East Boston that have been the sites of storage for oil and jet fuel for the entire city’s consumption, while putting their own communities at the most risk. Chinatown similarly faces increased levels of air pollution because of its proximity to Interstate 90 and 93.
Learn more about the effects of highways and risks of air pollution in Boston
People who live closer to the sources of pollution, often because of historical circumstances rather than choice, bear the unequal burdens of its effects. Within these highlighted maps, there are glimpses of a larger story about how oil moves through our landscape and is portrayed by the mapmaker. Looking beyond the pretty colors of the map allows you to notice the way these depictions are crafted. The path of oil through our landscapes has differing representations depending on who’s making the map, and whether their purpose is to appeal to consumers, or reveal the cost of consuming.
Our articles are always free
You’ll never hit a paywall or be asked to subscribe to read our free articles. No matter who you are, our articles are free to read—in class, at home, on the train, or wherever you like. In fact, you can even reuse them under a Creative Commons CC BY-ND 2.0 license.