Many visitors come to our gallery with a particular question in mind: What did Boston look like before it was filled in? When walking around Boston today, it might be hard to picture the tidal estuaries, shallow marshes, and mud flats that were filled in and topped with brownstones and tall buildings.
As early at 1722, colonists started to change the outline of Boston. They built wharves into the harbor and a mill dam over the northern inlet. By the turn of the 19th century, Boston’s landfilling project had changed the shape of the coastline almost in its entirety. Neighborhoods like the Back Bay, Seaport, and even sections of downtown are all part of this filled-in territory.
This map of Boston Old and New appeared in the first volume of Winsor’s book, Memorial History of Boston, Including Suffolk County, Massachusetts.
There are many questions people ask about Boston’s land: How much of it is fill? When was it filled in? And what did the shoreline used to look like? But ‘where the water used to be’ is by no means just a modern question—historians at the turn of the 19th century were drawing depictions of the Shawmut peninsula and comparing the city of two centuries prior with it’s then-current shape.
In 1880, historian, librarian, and cartographer Justin Winsor created this map of “Boston Old and New.” He overlaid the original Shawmut peninsula with the current reach of Boston, emphasizing the hills that were shortened to fill sections of harbor and the distinctions between marshy and level ground.
Even as early as 1880, none of Boston’s original shoreline touched the water, ringed instead with wharves leading out to the harbor. Also visible on this map are the modern car bars, railroad tracks and trails through the public garden.
This map celebrates a century of shoreline change in Boston, and will will be on display as a part of Becoming Boston exhibition.
The 19th century was a busy time for Boston when it came to landmaking. Similar to Winsor’s map, other overlays were created to contrast the difference between “modern” Boston and the original Shawmut Peninsula. This 1895 map celebrates a century of Boston’s expansion from 1793 to 1893, as Boston grows from the pink outline, to green, and blue by 1893, settling in the more familiar outline. On this map, one can also see the two train lines, the Boston & Albany and the Boston & Providence, that crossed the Back Bay and allowed for landfill to be easily transported into the city.
This subway map of Boston Proper indicates the original shoreline and radial distances from City Hall.
This overlay of Boston proper from around 1894 includes the streetcar and subway lines of Boston. At the time, almost all of the subway lines were on the original land of the Shawmut peninsula. You can see here that the subway line extends off into filled land at the corner of the Boston Public Garden before transitioning into a streetcar. The extension of the subway down Boylston Street required extra considerations in its construction due to groundwater level and softer soil. Knowing where Boston used to begin and end has practical applications as well.
This modern map illustrates the various land making projects that have shaped Boston over the past three centuries.
Of course, the collective fascination with Boston’s changing shoreline didn’t end after the 1800s. Many modern maps of Boston’s landfill also have a home in our collections. For example, this 2008 map of Boston uses satellite imagery as its base with an overlay of the city’s landfill three sections: the original land in red, land added before 1880 in gray, and land between 1880 and 2008 in blue. You can see that some of the last areas to be filled in were the airport, the Seaport, and the South Bay. This map also shows a hint of some of the landfilling that occurred along the waterfront in Cambridge and East Boston as well.
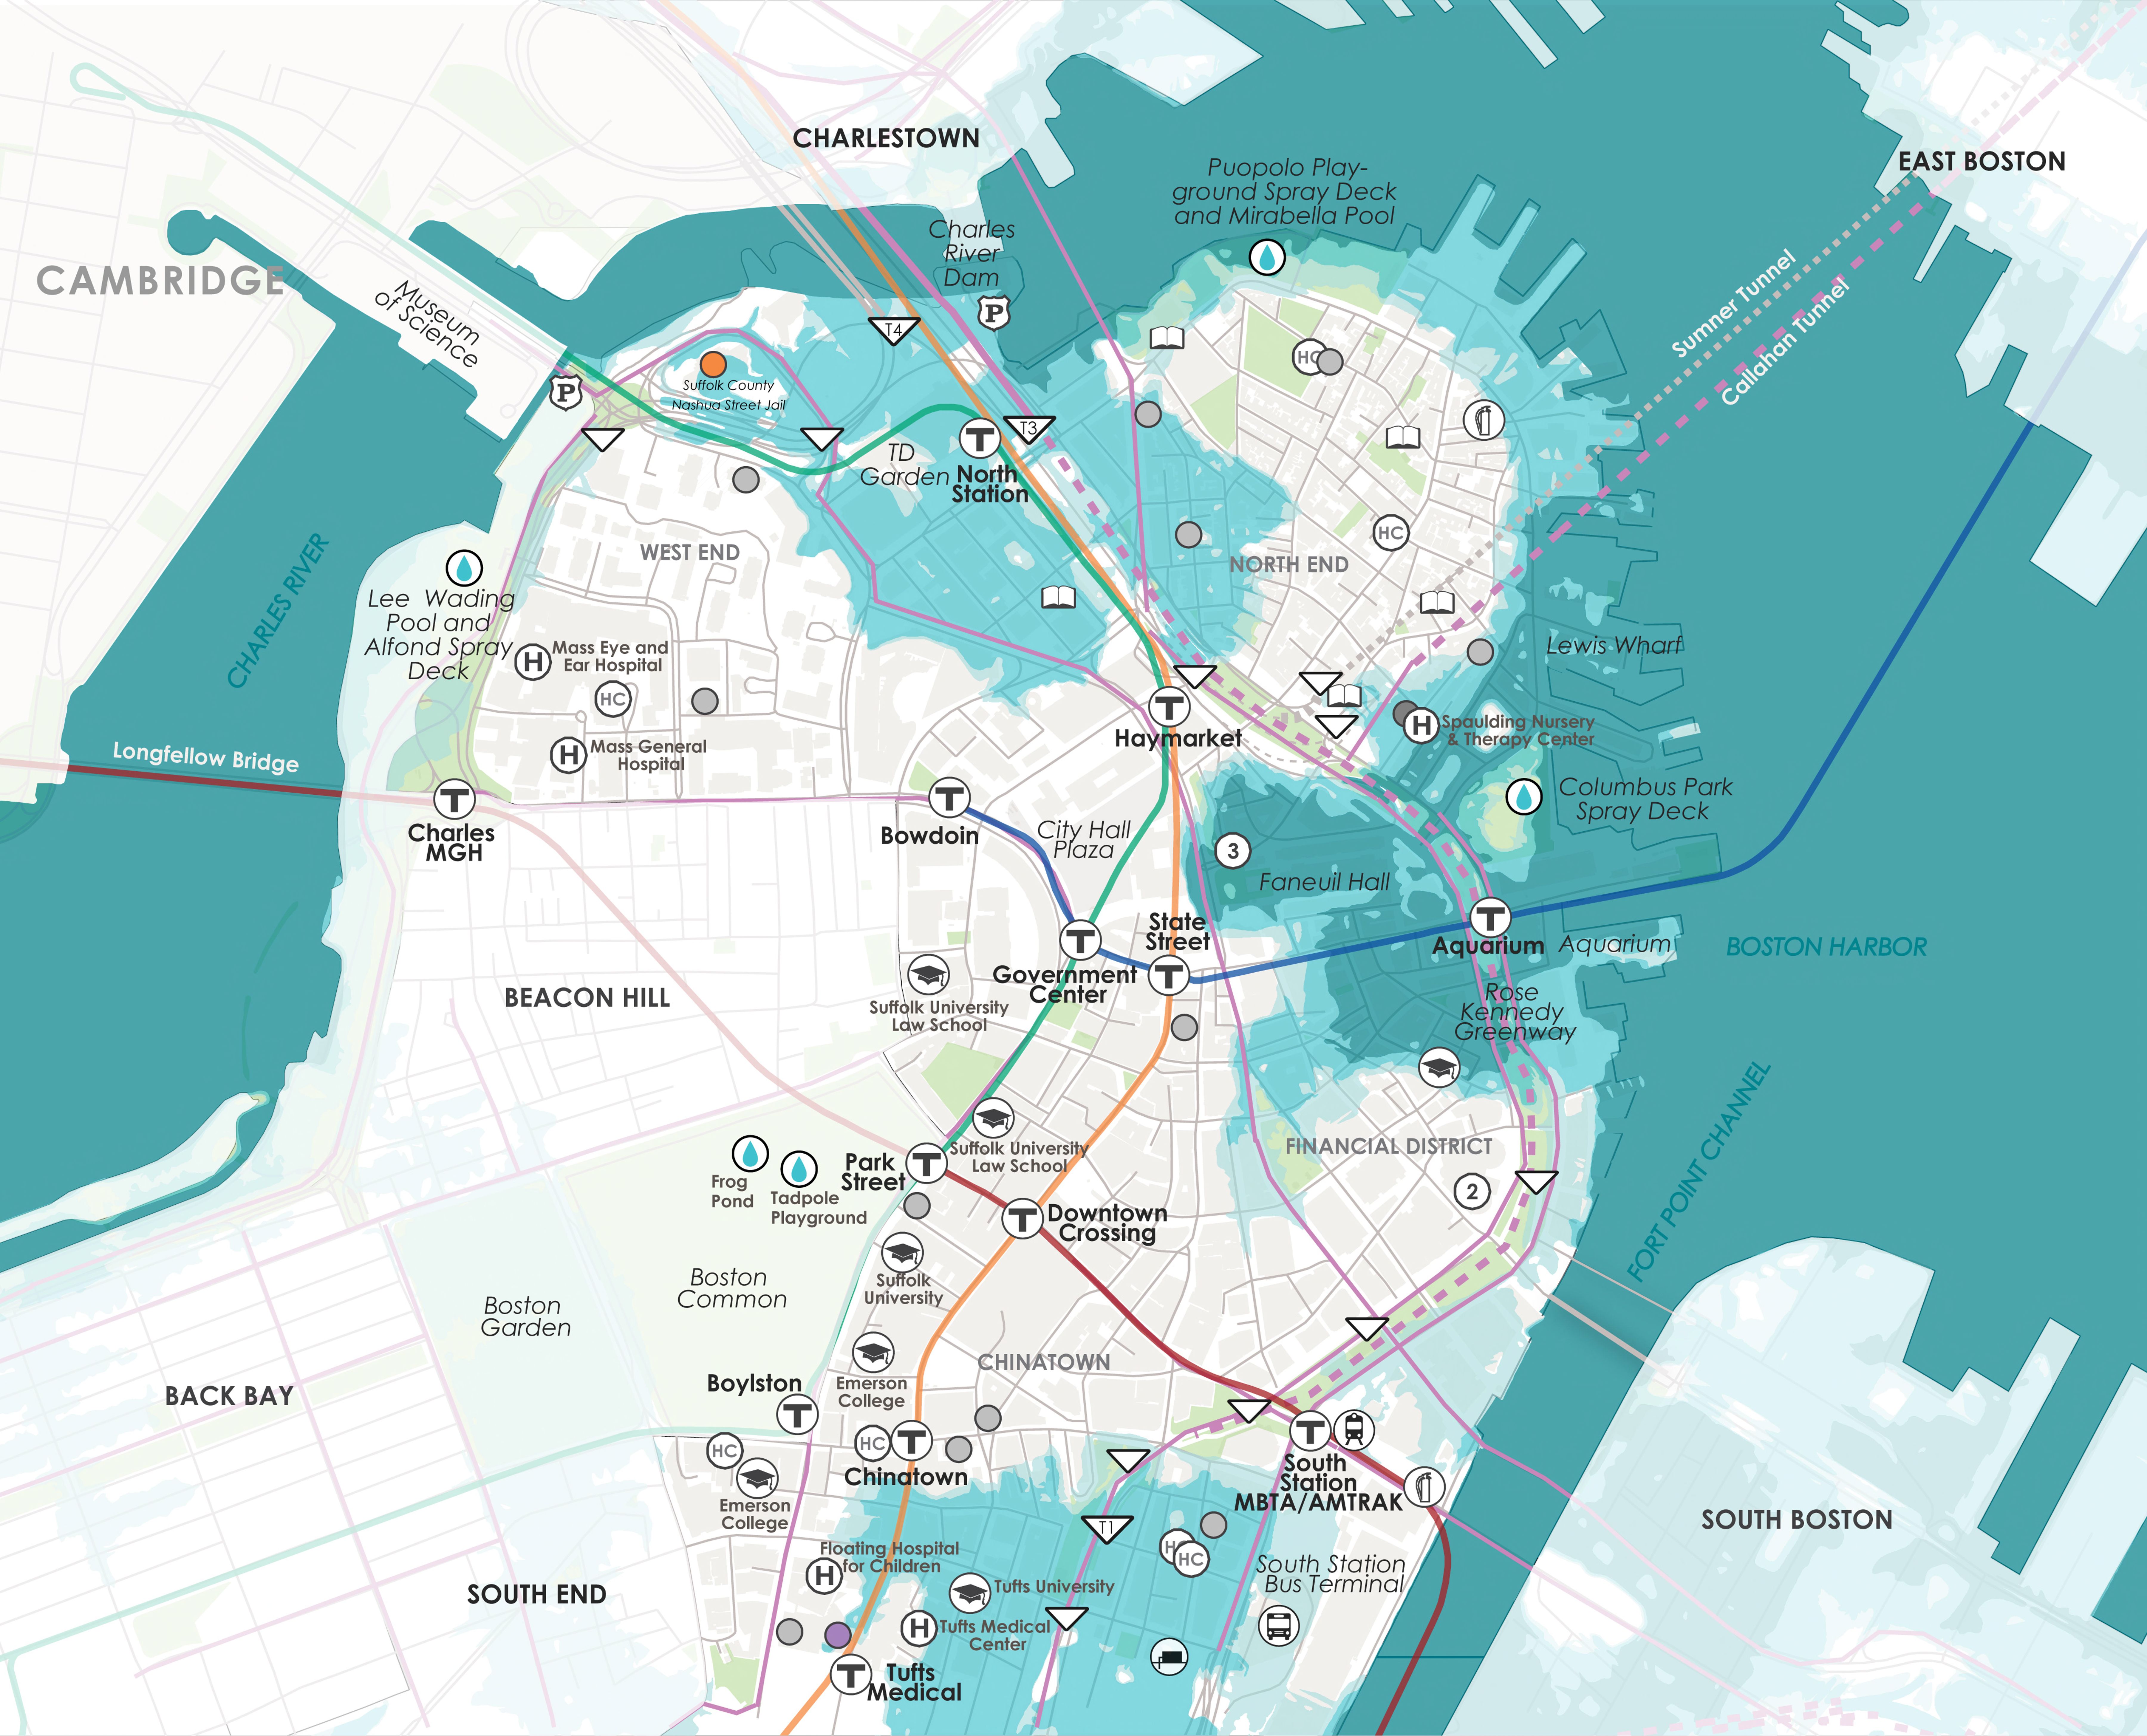
This flood risk map from Climate Ready Boston indicates areas of greater flood risk.
For centuries, people have wanted to know what is under their feet, whether they were plotting out subway lines, or trying to catalog where houses were in 1635. As many people want to see what neighborhoods used to look like or what shorelines used to be in their specific neighborhoods, they may turn to these overlays, georeferenced maps, or tools like Atlascope. And today, the question of “where the water was” becomes more relevant, with rising seas having the potential to reclaim areas that were once water again. Areas of the city that were filled in, like the Bullfinch Triangle and Long Wharf area, are more susceptible to flooding, as they are closer to sea level than many of the original parts of Boston.
Overlaying Boston’s shoreline with its modern landscapes is a great way for people to picture and understand Boston of the past. And next time you want to know where the water was, turn to maps; you’re not the first one to ask!
Interested in more maps that showcase the process of landfill and shoreline change in Boston? Here are 8 maps that explain Boston’s changing shoreline.
Our articles are always free
You’ll never hit a paywall or be asked to subscribe to read our free articles. No matter who you are, our articles are free to read—in class, at home, on the train, or wherever you like. In fact, you can even reuse them under a Creative Commons CC BY-ND 2.0 license.